The Earth's climate during the past 400,000 years
|
|
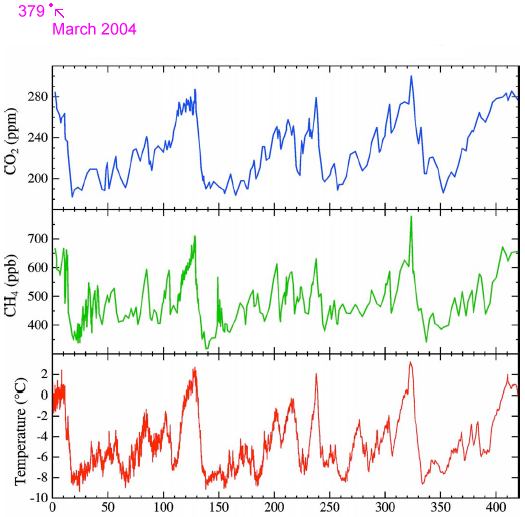
Antarctic Time Series for Carbon Dioxide, Methane and Temperature |
|
|
|
Thousands of years before present era |
The following observations may be made:
The curves for temperature, methane and carbon dioxide match very well.[3]
Carbon dioxide concentration has varied in a range of 180 to 280 ppm for 400,000 years. Now it is at 379 ppm which is well out of its historical range (This information has been added in violet to the original graph.) Carbon dioxide accounts for the majority of the greenhouse effect and so it is not surprising that temperature and carbon dioxide concentration correlates so well.
Methane concentration has varied in a range of 350 to 700 ppb for 400,000 years. Now it is at 1750 ppb--more than twice as great as any time during the past 400,000 years. The 1750 ppb point is not shown because it would show far above the graph. Methane is the second most important greenhouse gas.
![]()
[1] http://www.giss.nasa.gov/research/impacts/ NASA/Goddard Institute for Space Studies. The Antarctic ice core data is from a presentation called Can We Defuse the Global Warming Time Bomb? given in June 2003 by James Hansen. Look at the list of science briefs.
[2] http://www.sciam.com/ The above was reworked to become an article in the March 2004 issue of Scientific American. The new title is The Time Bomb of Global Warming (and How to Defuse It.) Readable and well done.
[3] http://www.daviesand.com/Choices/Precautionary_Planning/New_Data/ The same Antarctic ice core data but presented in a way that shows how closely carbon dioxide and temperature track during the past 400,000 years.
![]()