The History of Atmospheric Carbon Dioxide on Earth
The significance of carbon dioxide
Only one part in 2597 of Earth's atmosphere is carbon dioxide. Yet, plants make themselves from it. A very substantial oak tree is made from what seems like a few insubstantial air molecules. Plants use photosynthesis to make themselves from water, carbon dioxide and energy from the Sun. Atmospheric oxygen is a byproduct of photosynthesis. Animals reverse photosynthesis. They eat plants or they eat animals that eat plants. Animal metabolism consumes oxygen and releases carbon dioxide and water. The net effect of all this is a constant movement of carbon between plants, animals and the atmosphere.
Carbon dioxide and water vapor are the most important greenhouse gases. Without greenhouse gases, Earth would be an ice planet and there would be no life.
We humans, because of our numbers and our technology, greatly influence Earth's atmosphere. We need to understand what we are doing to Earth's atmosphere.
The recent history of atmospheric carbon dioxide
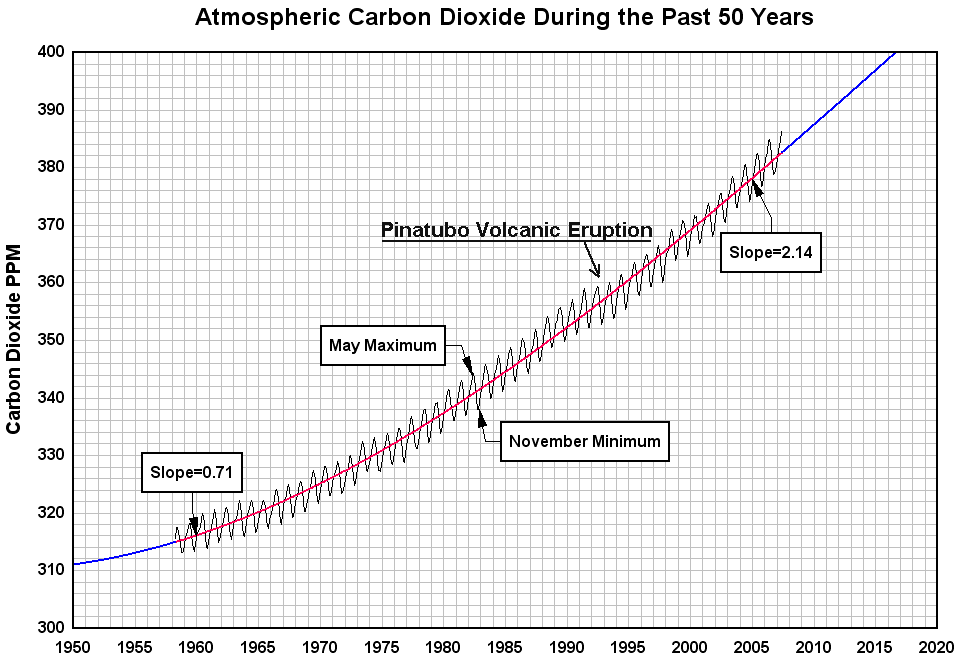
Charles Keeling began precise monthly measurements of the concentration of carbon dioxide in 1958. He was the first to do so systematically and so his data have come to be known as the "The Keeling Curve." Learn more about Charles Keeling at http://scrippsco2.ucsd.edu/home/index.php The measurements were made at the Mauna Loa Astronomical Observatory which is at the summit of an inactive volcano in Hawaii. Mauna Loa was chosen because it is far from major sources or sinks of carbon dioxide. Carbon dioxide concentrations measured at Mauna Loa are a good proxy for the average of the whole Earth.

 The black wiggles are a continuous record of the concentration of carbon dioxide
in the Earth's atmosphere from 1958 to May 2007. NOAA (National Oceanic & Atmospheric
Administration, which is a branch of the U.S. Department of Commerce) is the original
source of the data which may be found at http://www.esrl.noaa.gov/gmd/ccgg/trends/
This is data collected by competent scientists and it is not controversial.
The black wiggles record the breathing of all the plants and animals on Earth. Plants must inhale carbon dioxide to grow and as they do so, they remove carbon dioxide from the atmosphere. Almost all animals and bacteria exhale carbon dioxide as they go about living. Animals and bacteria are always active and so carbon dioxide concentration increases whenever plants are inactive. There are more plants growing in the Northern Hemisphere because there is more land mass in the Northern Hemisphere, as a glance at a globe will confirm. When all the plants in the Northern Hemisphere are growing during the summer, they remove significant amounts of carbon dioxide. The maximums occurs every year in May, at the beginning of the growing season. The minimums occurs every year in November, at the end of the growing season. All of this is quite visible on the graph.
The red line shows the same data but with the yearly variations removed. There are several ways this might have been done. Here, it was accomplished by fitting a curve called a 4th order polynomial to the data. The blue parts of the polynomial curve extend the record forward and backward in time. The red line is based on real data, the blue lines are plausible projections.
Interpretation of the Keeling curve
Clearly the amount of carbon dioxide in the atmosphere is increasing. Equally clearly, the rate of increase is increasing. In 1960 the rate of increase per year was 0.71 PPM (parts per million). The 2005 rate of increase was 2.14 PPM per year. However, the increase is not perfectly steady. The Pinatubo volcanic eruption of 1991 is credited with the slowing of the increase for a few years. The massive release of sulfur dioxide resulted in an increase in cloud cover which resulted in cooling which increased the solubility of carbon dioxide in sea water. The resulting slight pause beginning in 1992 is visible. The pause, whatever its origin, was canceled by an acceleration in the next decade. The Southern Oscillation also known as the El Niño--La Niña cycle also seems to have an effect. The general trend, however, is unmistakable.
Implications
If the general trend continues, the concentration of carbon dioxide will be 400 PPM within ten years. It is hard to avoid this conclusion. Nothing short of a large volcanic eruption or a nuclear war or a large meteorite strike would change this conclusion.
There is no doubt that the carbon dioxide increase is anthropogenic. The circumstantial evidence is strong. Human population increases track carbon dioxide increases. However, there is proof. Carbon dioxide circulating between plants, animals and the atmosphere is made slightly radioactive in the upper atmosphere by the sun. Carbon dioxide formed by burning fossil fuels is not radioactive because the carbon has not been in the upper atmosphere for millions of years. That makes it possible to distinguish anthropogenic fossil fuel derived carbon dioxide from the carbon dioxide circulating between plants and animals by measuring its radioactivity.
Atmospheric carbon dioxide during the last four ice ages.

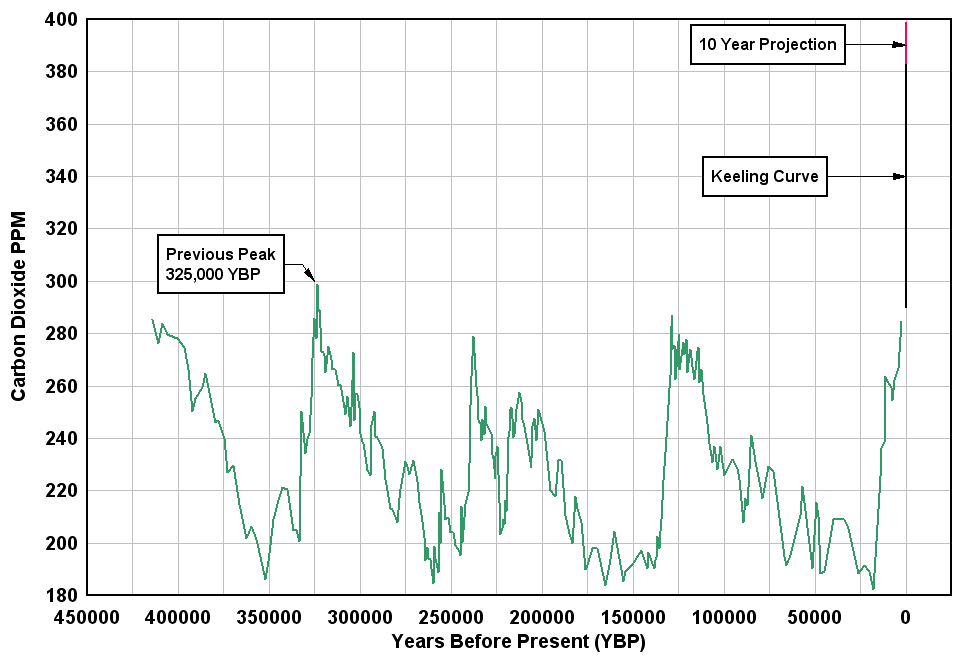
This graph puts it all together. It is a record of the concentration of carbon dioxide during the past four ice ages. The green part is from: http://www.ncdc.noaa.gov/paleo/icecore/antarctica/vostok/vostok_co2.html The data comes from air bubbles trapped in ice taken from a two kilometer hole drilled into the Antarctic ice sheet. It is like the preceding Keeling curve except that it extends 415,000 years back in time instead of 50 years. The Keeling curve has been added to the right side as indicated by the black and red. The horizontal scale prevents showing any detail.
At 400 PPM, the amount of carbon dioxide currently in the atmosphere is unprecedented, at least in the past 415,000 years. The last time it reached even 300 PPM was 325,000 years ago.
The amount of carbon dioxide in the atmosphere is strongly correlated to temperature and glaciation. The record is jagged, but it is easy to see patterns. When the concentration is below 240 PPM, kilometers thick glaciers cover most of Europe, Canada and the northern part of the United States. There are 4 ice ages recorded here. Note that temperatures decrease irregularly over a span of approximately 100,000 years while temperature increases are sudden and dramatic. We live in an era just after a rapid temperature increase.
Conclusion
If present trends continue, Earth's climate will be very different 100 years from now. Nearly all of the world's scientists agree on this. The only disagreement is about the amount and the rate of change.
 Climatology is a very complex subject and the preceding is only a foretaste. An
indepth report, written by 2,500 scientists from around the world, is available if you
want to know more. http://www.ipcc.ch/ The report was
written by the Intergovernmental Panel on Climate Change.