Extrapolating the Hubbert Curve to the Whole Earth
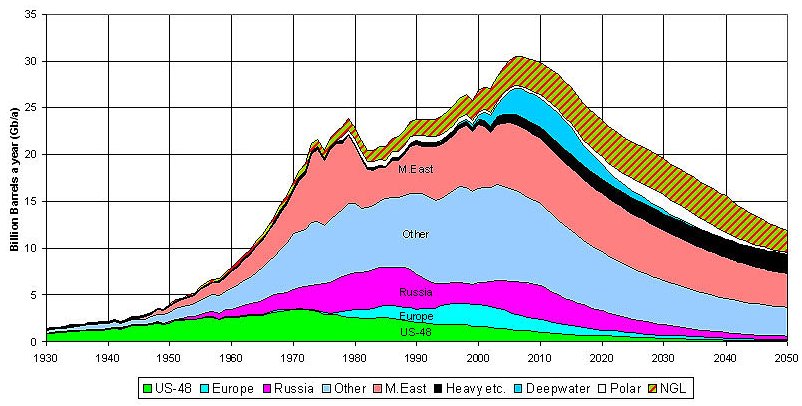
This graph show past and projected oil production for the whole Earth. It was
published in an ASPO Newsletter in 2004.[1] Hubbert model predictions are included.
Natural gas condensates(NGL) are lumped together with oil. This ASPO graph says we are
right at the peak in 2008.
All Liquid Fossil Fuels
The part before 2007 is historical fact. The part that comes afterward is an ASPO
extrapolation.
This graph is worth careful as a lot of world history is written into it. Note the
steep rise in oil production after World War II. Note that 1971 was the peak in oil
production in the United States lower 48. There is a sliver of white labled Arctic
oil. That is mostly Alaskan Prudhoe Bay oil, which peaked in 1990. Prudhoe Bay was
almost big enough to counteract the lower 48 peak of 1971. The sliver is very narrow
now. The OPEC oil embargo of 1973 is very visible. The oil produced by non-OPEC
countries stayed nearly constant while OPEC production nearly halved. The embargo
caused the world economy to slow. But the high cost of energy spurred the development
of energy efficient automobiles and refrigerators and a lot of other things. Note the
effect of the collapse of the Russian economy in 1990 on Russian oil production. Note
the rapid increase in oil production when the world economy boomed near the end of the
twentieth century. Oil was $12 a barrel at that time. Note that European (North Sea)
oil peaked in 2000. Note especially what would have happened if the 1973 embargo had
not occurred. It is possible that the world would now be on the steep part of the
right side of the Hubbert curve.
European (North Sea) and US-48 oil are slivers after 2020. Natural gas condensates and
heavy oil become more important. Deepwater oil and Arctic oil become important. The
sliver of white represents Siberian oil but might include Alaskan Northern Wildlife
Refuge (ANWR) oil.
Something Happens in 2010
Beginning in 2010, the Middle East can no longer compensate for declining production elsewhere. Production and therefore consumption will decrease and demand will have little effect on production. The decrease results from oil depletion and the realities of geology. Large increases in the price of oil will not greatly increase production but would reduce demand. Countries with no alternatives to oil will be forced to bid up the price of oil.
OPEC Will Dominate World Oil Production.
Here is a graph that presents the same data but the format emphasizes how OPEC will come to dominate world oil production. This happens for one blindingly obvious reason. OPEC countries have 75.5%[2] of the world's oil.
Total World Fossil Fuel Production Excluding Coal.
This graph show past and projected oil and natural gas production for the whole Earth. It was published in an ASPO Newsletter in 2008. (Planetforlife added the coloring.) It is the same as the previous ASPO graph except oil is all lumped together and natural gas has been added.
Including natural gas does not change the timing of the peak very much.
The Middle East and The Russian Federation have 66%[2] of the world's natural gas and so they
will soon dominate production.
The Age of Oil—The Long View
Clearly, we live in the age of oil, but it is drawing to a close. In the long view, it
did not last long—only one century.
It is hard to escape the conclusion that recent wars have something to do with energy
resources. It is disappointing to note that the world seems to be lurching toward a
series of energy resource wars.
Maybe it is time for the world to start thinking about life without fossil fuels. A
little planning could make things a lot easier.
Foot Notes
[1]
 http://www.peakoil.net/
ASPO(Association for the Study of Peak Oil) Here is their description; "ASPO is a
network of scientists and others, having an interest in determining the date and
impact of the peak and decline of the world's production of oil and gas, due to
resource constraints." An article is published every month and there is a large
archive.
http://www.peakoil.net/
ASPO(Association for the Study of Peak Oil) Here is their description; "ASPO is a
network of scientists and others, having an interest in determining the date and
impact of the peak and decline of the world's production of oil and gas, due to
resource constraints." An article is published every month and there is a large
archive.
 [2] http://www.bp.com/ British Petroleum
(BP) publishes the annual Statistical Review of World Energy. The Review is
widely referenced because it is convenient, complete, colorful and very well done.
However, the data do not reflect the company's own assessments--it is simply
republished data from other sources. One major source is the Oil & Gas Journal
but its sources are suspect as well. They get their numbers by simply asking
government officials. The numbers for the United States are probably reliable because
the oil companies are regulated by the SEC (Securities and Exchange Commission.) The
numbers for Norway and Britain are probably reliable as well. However, the numbers for
the Middle Eastern countries are whatever the countries say they are. They treat oil
reserve numbers as state secrets. The bad news is that the Middle Eastern countries
have reasons to overstate their reserves. Planetforlife takes these numbers at face
value mainly for expediency and convenience.
[2] http://www.bp.com/ British Petroleum
(BP) publishes the annual Statistical Review of World Energy. The Review is
widely referenced because it is convenient, complete, colorful and very well done.
However, the data do not reflect the company's own assessments--it is simply
republished data from other sources. One major source is the Oil & Gas Journal
but its sources are suspect as well. They get their numbers by simply asking
government officials. The numbers for the United States are probably reliable because
the oil companies are regulated by the SEC (Securities and Exchange Commission.) The
numbers for Norway and Britain are probably reliable as well. However, the numbers for
the Middle Eastern countries are whatever the countries say they are. They treat oil
reserve numbers as state secrets. The bad news is that the Middle Eastern countries
have reasons to overstate their reserves. Planetforlife takes these numbers at face
value mainly for expediency and convenience.