How Fast can you Pump Oil?
It is obviously important to know the extent of the world's oil reserves, but it is
equally important to know the rate at which oil can be produced(pumped).
 Oil statistics usually include the ratio of reserves to
production (R/P). It would seem that this is a measure of how long the oil will last.
This is misleading because of the assmption that production will remain constant until
the last drop is produced. Here is description of what really happens when an oil
field is discovered. At first, production grows rapidly as each new well adds its
output. Eventually production for the oil field reaches a peak as each new well
produces less oil and the older wells run dry. Then there is a rapid decay in
production as more and more wells run dry. The productivity of a particular well
depends on the rate at which oil flows horizontally toward the well head, the pressure
within the oil bearing formation and the viscosity of the oil. There is an optimum
rate of production for any well. If oil is produced too fast, some of the oil is left
behind and the amount ultimately produced is reduced. Increasing the number of wells
beyond a certain point increases the production rate without increasing the amount
ultimately produced.

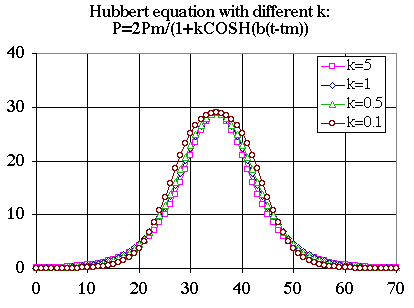
All of these factors add up to produce a bell shaped production curve with the top of the bell corresponding to the point when half the oil is gone. If everything is well behaved, an equation called a logistic describes the bell very well. It works on coal mines and gold mines too. M. King Hubbert used the logistic to predict a peak in oil production in the U.S. in 1969.[1] His employer, Shell Oil, tried to stop him from going public with his prediction. He did anyway in 1956 and he was ridiculed for it, but he was right. He missed by only a year.
Ilbehaved Systems

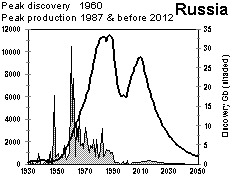
It should be noted that Hubbert's method works only when the system is well behaved. Oil production in the U.S. is a well behaved system and so Hubbert's method works well. The oil production curve for Russia does not look like a logistic and so Hubbert's method works less well. Economic collapse is not part of a logistic. But in general, Hubbert's method works so well that productivity curves for oil fields, and even other things, are now called Hubbert curves.
Some Interesting Numbers
Here are some numbers from the Oil & Gas Journal, Dec. 23, 2002. The interesting numbers are highlighted.
| Reserves (bb) | Production (bb/year) | R/P (years) | Producing wells | Production (barrels/well/day) | |
| Canada | 180 | 0.80 | 225 | 54061 | 41 |
| China | 18 | 1.24 | 15 | 72255 | 47 |
| Iran | 90 | 1.26 | 71 | 1120 | 3080 |
| Iraq | 112 | 0.74 | 152 | 1685 | 1204 |
| Kuwait | 94 | 0.58 | 162 | 790 | 2025 |
| Norway | 10 | 1.15 | 9 | 833 | 3782 |
| Russia | 60 | 2.70 | 22 | 41192 | 179 |
| Saudi Arabia | 259 | 2.69 | 96 | 1560 | 4730 |
| U.S. | 22 | 2.11 | 10 | 521070 | 11 |
| Venezuela | 78 | 0.88 | 88 | 15395 | 157 |
Canada had 6.5 billion barrels in reserves in 2001 but now it has 180 billion barrels
because of the inclusion of tar sand, as mentioned earlier. Norway was a major oil
producer but it passed the peak of the Hubbert curve in 2000. Productivity is now on
the down sloping side of the curve. This is happening fast as indicated by the an R/P
of 9. However, at 3782, the productivity per well was very high. That is necessary
because of the high cost of pumping oil from the North Sea.
At 521070 oil wells, the U.S. has more oil wells than the rest of the world combined.
Yet the total productivity is sliding down the right side of the Hubbert curve. U.S.
production is much less than the peak year of 1970 and the R/P of 10 means not much is
left. More wells and better technology increases the rate of oil production, but total
amount of oil produced is increased only a little. Compare the productivity per well
of the U.S. (11 barrels per day) with Saudi Arabia (4730 barrels per day).
Foot Notes
 [1] Beyond Oil; The view from Hubbert's Peak by Kenneth
Deffeyes. (from Amazon.com review) "This succinct book is an engaging view of Peak Oil
by a gruff, no-nonsense petroleum geologist. It is not just a concise overview of the
origins of oil and the significance of the Peak. Think of the Peak as that era when
the price of oil soars because supply can no longer meet demand, no matter how hard
the effort to increase production. For the mathematically literate, Deffeyes gives the
best popular explanation yet of the Hubbert method of calculating Peak Oil. Deffeyes
curve-fit puts the peak at 2006 - hence his sense of urgency."
